ingridscience

Light attraction of brine shrimp (and other pond organisms)

Summary
Expose brine shrimp to light and notice how they are attracted to different colours. Discuss as a possible adaptation.
Materials
    To grow the brine shrimp:
  • brine shrimp eggs (aquarium stores carry them)
  • clear plastic box
  • sea salt
  • tap water, left to stand overnight to release the chlorine
  • pipette to transfer brine shrimp
  • small glass jar or other transparent container, for transporting shrimp to the lesson
    For shrimp observation and light attraction activity:
  • brine shrimp, about 100 per dish. Juveniles worked well for me, 1 or 2 days after hatching.
  • optional: 20X - 40X microscope(s), ideally with an adapter to view image on a classroom screen. I use a microscope attachment for my smartphone (Carson HookUpZ) then view the camera image on a screen via Apple Airplay
  • petri dishes (or other shallow dish with lid), completely covered in black paper and black tape, except for one corner of the lid (see photo) - there must be no light leakage or internal reflections (see note)
  • flashlight
  • coloured filters - red, yellow and blue ideal (I use scrap acetate sheets left over from industrial colour printing, from Urban Source in Vancouver)
  • worksheet (see attached)
  • optional: other pond organisms to test
Procedure

Grow the brine shrimp for the lesson:
Start growing the shrimp two or three days before the lesson. Prepare 2% sea salt in dechlorinated tap water (i.e. 2g salt in 100ml water or equivalent - I use 20g in a litre of aged tap water), enough to fill the plastic box to a depth of 3-5cm. Sprinkle brine shrimp eggs over the surface, to make a sparse coating. Leave in a space with natural light, undisturbed. (Some sources say to add a bubbler to the water, to provide more oxygen, but for my use I have found that this is not necessary, though my hatch rate is likely lower.)
The shrimp should hatch after a day or two, and can be left another day or maybe two before using for the activity (I wait 2.5 days after adding the eggs to the salt water, before harvesting) After too many days without food or water replacement, that remove ammonia and other toxins, the young shrimp (called nauplii, singular: nauplius) will start to die.
To harvest the shrimp for the lesson, place near a bright window, with one corner of the box facing the window. If a window is not bright enough, point a flashlight at the corner of the box. Raise up the end of the box facing the light with a book.
The shrimp will move towards the light, so wait a few minutes, then use the pipette to suck up a concentration of shrimp in the shallower water nearest to the window. Transfer to a small jar or other container to bring to the lesson. Avoid the empty egg cases floating on the surface of the water.

Observing brine shrimp closely:
At the start of the lesson transfer about 100 shrimp to each blacked-out petri dish. Ideally have one dish per pair of students.
Hand out one flashlight for each dish, and ask the students to keep the lid off, and use the flashlight to find the shrimp in their dish. Show them by scanning the flashlight over the dish at an angle, the shrimp can be found more easily. Ask students to watch the movement of the shrimp - they will move along in a jerky way, following a zig-zag path.
This is a good time to use a higher power microscope to look at a shrimp closely. Ideally project the image on a screen so that the parts of the shrimp can be discussed together more easily. The juvenile shrimp use their antennae as paddles to push (or "row") through the water, hence the jerky movement. As they get older they will grow legs and swim with a smoother motion. The juvenile has one eye at the front of the head. They will later grow a pair of eyes, located on the sides of the head.
The juvenile will initially eat the yolk remaining from the egg it was born from, then start to feed on tiny algae in the water.
Brine shrimp are found naturally in salt water, such as the Great Salt Lake in Utah, the Caspian Sea, inland salt swamps, as well as in coastal waters near San Fransisco. They need salt water, but can live in salt concentrations as low as sea water (about 3%) or as high as 50%!

Light attraction of brine shrimp:
While looking closely at the shrimp, some students may have noticed that they are attracted to the light. ("Phototaxis" is the term for movement in response to light, and attraction to light is called positive phototaxis.) This observation introduces the activity.
Ask all students to observe the attraction of shrimp to (white) light using these steps:
1. Gently swirl the dish to distribute the shrimp evenly, then carefully place the lid on.
2. Hold or rest the flashlight over the open corner of the lid, and wait one minute, without disturbing the dish.
3. Carefully lift the lid, without jostling the dish, and immediately look to see where the shrimp are distributed. Quickly scan the flashlight over the dish to find the location of all the shrimp.
Most of the shrimp will be gathered under the location of the light. Not all of the shrimp will have moved there though. This distribution of shrimp is called a "strong attraction" to light. (See photo of instructions and shrimp distribution images.)
Discuss why the shrimp might be attracted to the light: they eat algae, which are near the surface of the water where there is more light. (The algae need light for photosynthesis so they collect where there is more light.)

Explain that different colours of light attract shrimp differently, and that the students will find out which colours shrimp are more attracted to.
Hand out the filters.
Ask students to repeat the steps as for the white light (1. swirl dish, 2. light over dish, 3. look at distribution), but with filters between the dish and the light, so that the shrimp are exposed to different colours.
(We used two of each filter colour, which I had previously determined to give best results i.e. for blue light, use two blue filters, for red light use two red filters, for green light use one blue and one yellow filter etc.)
Make sure that all students try blue, red and green light, then they can mix pairs of filters to try any other light combinations they wish. Students use a worksheet to record whether the shrimp are "strongly attracted", "weakly attracted" or "not attracted" to each light colour.

The students should find that the shrimp are strongly attracted to blue light, and not attracted (or weakly attracted) to red light. We found that shrimp are also strongly attracted to green and purple light. We did not have enough data points to graph yellow and orange light.
See the data photo for our results (S indicates strong attraction, W indicates weak attraction, - indicates no attraction, with the number of dishes reporting for each). See the graph for our results of those colours with 11 or 12 dishes reporting. With more time, more groups can try all the colours.

Discussion of possible reasons for attraction to certain light colours.
Allow students to speculate as to why brine shrimp might be more attracted to certain colours. Encourage thought around what might help these animals survive (e.g. food, habitat etc). Encourage them to come up with other experiments to try (and a hypothesis to test) to find out.
During discussion, inject some ideas:
1. The food source of brine shrimp is blue-green algae - it might be advantageous to be sensitive to the colour of a food source, and to swim towards it.
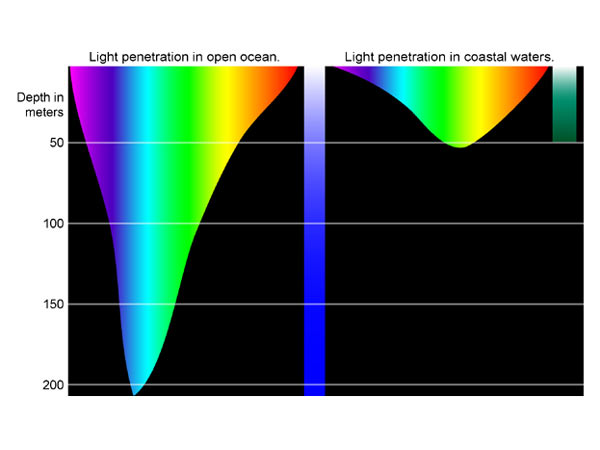
2. The attraction to certain light colours correlates with how deep different colours penetrate water
e.g. https://i.pinimg.com/736x/0c/c0/50/0cc050beb2c576415fd0ab7238b7e4c9.jpg
e.g. http://oceanexplorer.noaa.gov/explorations/04deepscope/background/deepl…
Our shrimp were also strongly attracted to green and purple light, which penetrate fairly deeply into water, though not as deep as blue light.
Could shrimp have an adaptation that allows them to follow blue light to the surface of the water (where their food lives?)
(Note: I have not found much scientific research on light colour attraction specifically by brine shrimp, though there are many papers on light attraction by collections of small ocean animals, and how attraction varies with time of day, season, age of the animal, and wavelength of light - this is very current research that the students are doing their own experiment alongside.)

Other discussion points, if results are not aligned with the penetration depths of different light colours:
The filters being used are not passing a narrow band of light colours, but let other wavelengths through (I doubled up my filters to tighten up the data).
By adding filters, the intensity of the light is also reduced, which shrimp may also be sensitive to.
The wavelengths given off by the flashlight will also likely change the data. (I used a cool-white LED flashlight.)

Super interesting aside: as red light does not penetrate deeply into the ocean, deep ocean animals are red-coloured, so that they are camouflaged in the blue light of the deep ocean.
e.g. https://oceanexplorer.noaa.gov/facts/animal-color.html
Look at this image through a blue filter, and see the red animals of the deep ocean disappear!

Light attraction of other pond organisms
Other pond organisms show light attraction to white light (I have not tried other colours). Collect a dense population with a fine net to test.
Use the same set up indoors as for shrimp. Outdoors, the light of the sun can be used: collect pond life in a blacked-out dish, and place it on the ground in bright light. Leave the lid on for a few minutes, then remove the lid and immediately look for the distribution of the animals - they will be under the portion of the lid that was open to the light (see last photo). Just like the brine shrimp, they are attracted to light ("positive phototaxis").

Notes

The shrimp are attracted to light reflections within the dish, so make sure the tape is completely attached to the dish, to avoid shiny spots.
Or try painting the dishes with black out paint?
Each petri dish holds 25-30ml.

More brine shrimp rearing and experiments: www.britishecologicalsociety.org/wp-content/uploads/Brine-Shrimp-Ecolog…

Grades taught
Gr 3
Gr 4
Gr 5
Gr 6

Decomposing foods

Summary
Allow bread and drinks to decompose over time under different conditions. Discover the living things responsible for decomposition and how different conditions affect their growth.
Materials
  • slices of bread with different shelf lives
  • sandwich baggies
  • spray bottle of water
  • drinks e.g. milk, apple juice, soda
  • petri dishes or other shallow dishes with lids
  • a place to store the bread/liquids for 3 weeks where they will not be disturbed
  • worksheet for recording conditions and results
Procedure

Note this activity several days and up to two weeks.

Set up

Breads:
Students can choose what conditions they would like to test for how they affect the decomposition of bread. They should set up a series of samples, and record the treatments on a worksheet. Make sure that students understand that they should only change one variable at a time to conclude how a variable affects decomposition. If several groups are setting up the experiment, groups can pool their data as long as they are fairly consistent in how they handle the samples while setting up the experiments.
Examples of variables to try:

Variable Sample or Treatment
type of bread
  • short shelf life - local bakery bread with one day shelf life
  • medium shelf life - supermarket bread with 3 or 4 day shelf life
  • long shelf life - supermarket bread with ~10 day shelf life
moisture level
  • low moisture - leave baggie wide open or cut a hole in the top of the baggie
  • medium moisture - seal baggie with bread inside
  • high moisture - mist bread with water before sealing inside baggie
light level
  • high light - bread in baggie left near light from a window
  • low light - bread in baggie wrapped in dark cloth or put in a dark box
temperature
  • room temperature - bread in baggie left at room temperature
  • cool temperature - bread in baggie put in the fridge (note that this cannot be combined with high light treatment, as a fridge is dark)

Drinks:
Students should add one of each kind of drink to a petri dish, for example:

  • milk
  • refrigerated apple juice
  • sprite or other light-coloured soda

They can also choose one of the liquids and change another variable e.g. temperature, light level.
Make sure the drink samples have lids, or the liquid will evaporate away during the experiment.

Allow decomposition to occur
Leave the bread and drinks undisturbed for a week, then ask students to document any changes on the worksheet. They should notice changes in texture, colour and smell.
For safe smelling of a sample that might have unpleasant odours, teach students how to waft air from above a sample towards their nose (rather than sniffing the sample directly). If they find mould, they can record the number and colour of the colonies. They should leave the samples in their baggie/keep the petri dish lid on, to avoid possibly unsafe ingestion of mould spores.
Expected results:
After a week for the drinks, the milk will be clumped and stinky (discard it after the lesson), the apple juice may have a mould colony on it or not, the soda will be unchanged (except for gas that has come out of solution).
After a week for the breads, the bread with the shorter expiry dates will be starting to grow mould, especially if sprayed with water. Students can count the number of mould colonies. Make sure the students look for small colonies and under the bread too. The bread with a 10 day expiry date will be unchanged.

If there has been a lot of mould growth, likely because of higher classroom temperatures, maybe move to discussion of results and mould observation. If the mould colonies are small (1cm diameter or less), an additional week of growth is recommended to grow more impressive colours and colony sizes.

Discuss results
After final documentation of changes observed, discuss the class results in terms of conditions that living things that promote decomposition thrive in. A consolidated table of class results can help with discussion, though it can be complex with the many possible variables. If results across groups are compared, be sure to compare results with only one variable changed between them.

Drinks:
The soda likely did not encourage any mould growth. Read out the soda ingredients, and point out that it does not contain many nutrients (apart from sugar) that mould needs for growth.
Fresh apple juice likely had some mould growth, and the ingredients of apple pulp contain many nutrients as well as sugar, that mould needs for growth. Boxed apple juice that is sold at room temperature may yield different results.
Milk was clumped and stinky very fast. Discuss the microorganisms present in milk (mostly harmless bacteria) and that at room temperature, they have grown and multiplied. Specifically, the harmless bacteria Lactobacillus is present in milk (it is not destroyed by pasteurization), and as it grows it releases (lactic) acid. Acid interacts with milk proteins to make them clump. (Some harmful bacterial spores also survive pasteurization, which is why milk should be kept in the fridge, and should not be consumed if the milk is spoiled.) rapidly spoiled from bacterial growth, but given time, mould would likely have grown in the milk too. Milk provides a host of nutrients for growth of bacteria and mould.

Breads: The breads will be variable in how much mould grows on them, depending on the conditions.
Shelf life: Bread with a longer shelf life will generally have less mould growing on it. Read out the ingredients to challenge students to figure out why it may stay fresh longer. Preservatives such as calcium propionate and sorbic acid, are added to long shelf-life breads. They inhibit mould and bacterial growth.
Moisture level: Bread out of a bag turns dry very quickly and does not allow any mould growth. Bread enclosed in a bag grows mould as the bread contains some moisture. Bread that is misted with water before putting in a bag will grow a lot of mould. Conclude that mould grows better in a moist environment.
Light level: Moulds generally grow faster in the dark vs in bright light, though this is not universal. (Our breads did not show a strong difference between bread in the light and wrapped in dark cloth, maybe because all the samples were stored on a high shelf which was not well lit).
Temperature: Mould would be expected to grow faster in warmer conditions. This is why we put food in the fridge to slow down deomposition and the spoiling of foods.

Use microscopes to look closely at mould:

Transfer a piece of the mouldy bread to a petri dish to look under the microscope, or place the apple juice dish under the microscope to look at its mould.
Mould reproduces like every living thing. Long wispy hyphae spread out from where a mould spore landed. The hyphae grow over and through the bread/drink. Some hyphae grow upwards, and form spore heads at the top. As the spores at the centre of the mould colony ripen they darken, and the dark colour spreads outwards as more spore heads are formed. Different moulds have characteristic colours because of their spore colours. Rhizopus (black bread mould) has black spores, Neurospora (red bread mould) has red-brown spores, Penicillium has blue green spores in the centre of the colony with a white ring surrounding the colony.
Students should be able to see the long wispy hyphae of the mould around the edge of a colony using 10X or 20X power (see photo of mould on apple juice). With higher power the vertical hyphae with tufty spore heads may be visible, though individual spores are too small to see (see photo on bread; compare to web image: http://2.bp.blogspot.com/-m6wEVx0nI4g/ULobDEplvAI/AAAAAAAAIKc/Tju6woNRn…).
Watch a video of mould growth in slow motion, to show the hyphae growth, followed by spore formation and darkening. https://www.youtube.com/watch?v=JsQHWj2RfXg is a beautiful video.

Attached documents
Grades taught
Gr 4
Gr 5
Gr 6

Candle see saw

Summary
Make a see saw from burning candles.
Materials
  • birthday cake candles
  • straw
  • straightened paper clip or piece of wire
  • two safety pins
  • masking tape
  • supports e.g. popsicle sticks taped to tubs
Procedure

Tape the safety pins to the popsicle stick supports, with the small hole facing upwards. Make sure they are at the same height.
Push the candles in the ends of the straw. Find the balance point of the straw. Poke the straightened paper clip through the straw, then balance between the small holes in the safety pins. Turn the end of the straight wire so that it does not fall out of the safety pins.
When both candles are lit, they will see saw as wax drips from one then the other and their weights change. The see saw will spin all the way around too.

Grades taught
Gr 4

Energy input and output in devices

Summary
From a list of types of energy and a collection of devices and items, students figure out what kind of energy enters each device and what type leaves - the types of energy they transfer.
Materials
  • collection of devices that transform different kinds of energy, with labelled cards e.g. fan, light bulb, speaker, kettle, telephone, battery, candle, magnetic stripe card, ukulele (or other stringed instrument), elevator, microwave, plant
  • worksheets (attached)
    Procedure

    Before the lesson, arrange the devices throughout the classroom so that the students can walk around to visit each. Add a visible card next to each, so that they can find each device or item. Ideally the devices are functional e.g. the fan is blowing, the light bulb is on, the speaker is playing music.

    Review types of energy with students:
    gravitational potential energy is the energy stored in an object when it is high
    kinetic energy (also called motion or mechanical energy) is the energy an object has when it is moving
    heat (thermal energy) is the energy in something warm (the total vibrational movement of the molecules is the heat of a material)
    sound energy we can hear as noises
    light energy is the energy in light emitted from an object
    nuclear energy is the energy contained in the nucleus of an atom
    electrical energy is the energy carried by electricity
    chemical energy is the energy contained in the chemistry (i.e. the molecules) of an object or living thing, often created and released through chemical reactions
    elastic potential energy is the energy stored in something that is stretched (before it returns to its unstretched state)
    magnetic energy is sometimes also listed as a stored energy in magnets

    Students visit each device and record on their worksheet the type of energy they think makes the device work (i.e. the input energy) and what kind of energy it produces (i.e. the output energy). They draw a line from an energy input type on the left to energy output type on the right, then write the name of the device/object on the line. There may be more than one kind of energy produced by a device, and more than one kind of energy may make a device function. They may not use all the energy types on their worksheet. Try and focus students on the input energy that is the last energy to enter the device, and the output energy that the device is intended to produce. They can make notes on other kinds of energy that are unintended output energies (often heat and sound).

    Discuss their results.
    There are often no wrong answers, as students will see many of the ways that devices function. Students may also make educated guesses as to how devices work (e.g. is there a magnet it there that makes it work?) - encourage discussion around these ideas.

    List of devices/objects with likely energy inputs and outputs:
    fan: electrical in, motion (of the air molecules) out
    light bulb: electrical in, light out. heat is often also an output energy of lightbulbs, so making them less efficient
    speaker: electrical in, sound out
    kettle: electrical in, heat out (also sound out)
    telephone: sound in (also motion in as you dial the number), electrical out
    battery: chemical in, electrical out
    candle: chemical in, light (and heat) out
    magnetic stripe card: magnetic in (of the encoded magnetic pattern in the stripe), also motion in as you swipe it, electrical out (as the card communicates with the card reader)
    ukulele (or other stringed instrument): elastic potential energy (of the stretched string) and motion energy (of the hand strumming) in, sound out
    elevator: electrical in, gravitational potential and motion energy out
    plant:light (of the sun) and chemical (of the minerals and water) in, chemical out (as the plant grows by building up chemical structures)

    Discussion around electrical energy production and renewable energy
    Students may notice that many of the devices require electricity as an energy input. This can lead to discussion around how we produce electricity.

    • Fossil fuels (coal, oil, natural gas) are used extensively for energy production. The fuel is burned to make heat, which is used to boil water and make steam (chemical energy to heat energy to motion energy). The steam is channeled over turbines, which turn with the movement of the steam (motion energy). Turbines are connected to generators to make electricity (motion energy to electrical energy). When the fuels are burned they produce carbon dioxide, which is a greenhouse gas, so contributing to global warming.
    • Nuclear power uses the energy contained in a uranium atom. Uranium atoms are split to make heat. The heat is used to heat water and make steam which flows over turbines which powers generators to make electricity. Nuclear power stations can be built safely, but the nuclear waste from this kind of energy production is a problem.
    • Optional: to help understand how generators work, demonstrate a motor. A motor is a wire with a current through it next to a magnet, and the forces combine to make the wire move. A generator is the reverse: a wire made to move next to a magnet produces a current in it, which is electricity.

      Renewable energy sources are becoming more common, with the urgency to curtail global warming.

    • Solar power is the conversion of light to electrical energy. Photovoltaic (PV) cells make up solar panels which convert light directly to electricity. Concentrated solar power (CSP) concentrates sunlight to make enough heat to drive a steam turbine and electricity generator.
    • Hydroelectric power uses the gravitational potential energy of water behind a dam to drive turbines as it falls, which are hooked to generators. This is the most common renewable energy. Dams can be negative in that they flood whole ecosystems and maybe human communities, but they can also be positive in making a reservoir for areas that have long periods of drought.
    • Wind energy uses the motion of wind to turn turbines, which are connected to generators.
    • Geothermal energy uses the heat energy deep in the earth. Pipes running deep underground and up again (called geothermal heat pumps) can bring the heat to the surface, where it can be used directly to heat buildings. Alternatively, steam is either collected from underground, or made by injecting water into the warmth underground. Above ground, the steam drives turbines and generators. Iceland uses 90% geothermal heating.
    • Wave energy uses the motion of the waves to drive turbines.
    • Tidal energy uses the rising tide to fill a reservoir, from which water can later fall to drive a turbine.
    • Biomass energy (or Bioenergy) is the method of burning organic matter to make heat for steam that drives steam turbines. Vegetable oil crops, algae, compost, mature, methane from cow farts are kinds of biomass used for this kind of energy production.
    • Salt and temperature gradients in the ocean can be used for making energy

    See https://www.nationalgeographic.org/encyclopedia/renewable-energy/
    https://www.environmentalscience.org/renewable-energy

    Notes

    Other devices to add: microwave, wind up toy, light stick, watch driven by nuclear energy??
    Note that magnetic force is not a kind of energy.
    Elastic band car instead of jumping stick would touch on design elements: needs elastic power, wheels, axle, body.

    Grades taught
    Gr 3
    Gr 4
    Gr 5

    Fruit and vegetable indicator dyes

    Summary
    Crush blue, red and purple-coloured fruits and vegetables. Add acid or base to find which ones have pigments that change colour with acid-base.
    Materials
    • red, blue and purple fruits and vegetables. Red cabbage and radish skin work really well. blueberries and grapes are OK.
    • sharp knife
    • mortar and pestle
    • water
    • vinegar in a dropper bottle
    • 1 tspn baking soda in 1 cup water, in a dropper bottle
    • paint tray or white ice cube tray
    Procedure

    Peel/chop fruits and veggies, to collect small pieces of coloured material.
    Add to the mortar and pestle with very little water and crush to make a concentrated coloured liquid.
    Pour a little of the coloured liquid into wells of the tray.
    Add drops of acid and base to change the colour (or not - results are very variable).

    Notes

    isas tried apple, peach, radish skins, blueberry skins, red onion.
    Seymour tried red chard stems and beetroot. Red chard slightly changed colour, beetroot did not.

    Grades taught
    Gr 4
    Gr 5
    Gr 6
    Gr 7

    Sedimentary uplifting (with optional fossil discovery)

    Summary
    Model sedimentary rock formation and uplifting with layers of sand and sugar. Discuss formation of mountains. Optionally add fossils to the layers to show how they are exposed on uplifting.
    Materials
    • clear high-walled container - long drawer organizers work well. Ideally one per student pair
    • stiff card that fits snugly across the width of the container - it may need to be cut at an angle to accommodate walls that flare out
    • granulated sugar in a recycled water bottle or similar container with narrow mouth (about 300g)
    • dry sand of a darker colour (e.g. beach sand from which shells, small rocks etc have been sieved) in a shaker dispenser (e.g. herb container or pepper shaker with large holes)
    • tissues or cloths that fill about half of the container
    • optional: tray or cloth to contain spilled sand and sugar
    • optional: brush for table clean up
    Procedure

    This activity models how sedimentary rock layers are formed, and then uplifted.
    Optionally, paper fossils can be added to the sedimentary layers, to model how fossils are exposed as uplifting and erosion occurs.

    Demonstrate making the sedimentary layers (just two or three, before students' turn):
    Layer the sand and sugar alternately in the container. It seems to work best if the lighter sugar layers are about 1cm deep and the dark sand layers are 1-2mm deep. Make at least three layers of each, depending on the container size.
    This step models how sediment is carried by water and wind, to build up in layers in oceans, lakes and deserts.
    As layers add on the top, the lower layers are compressed, eventually forming sedimentary rock as they get deep enough.

    Modelling fossil formation:
    Sometimes when an animal or plant dies it falls into the sediment.
    If adding fossils to the model, add the oldest fossil e.g. Trilobite to one of the bottom layers (Trolobites lived 500 Mya to 250 Mya; Cambrian through Permian). Add a more recent fossil to the layer below the top layer e.g. Pterosaur (Pterosaurs lived 200Mya to 65Mya; Triassic through Cretaceous). See last two photos.
    Hard animal body parts such as bones and shells are preserved in the sediment and are slowly turned into rock. Hard plant parts can be preserved, or plants make impressions (prints) between rock layers.

    Students make their sedimentary layers, optionally adding fossils.

    Demonstrate uplifting:
    Hold the cardboard paddle upright and push it to the bottom of the container of sedimentary layers, at one end. Slowly slide the cardboard along the container, making sure that it stays touching the bottom as it moves. Try and move it as smoothly as possible.
    Sand and sugar may spill out of the top of the container. Watch through the side as the layers buckle and fold.
    Stop the uplifting when the folds are clear before they start getting muddled up - when the cardboard paddle is about half way along the container. Then add lightly crumpled sheets of tissue to hold the paddle upright in place.
    The sand and sugar spilling from the top of the container mimics erosion - the top of a mountain is worn away by wind and water - exposing lower layers of rock.

    Students uplift their sedimentary layers.

    Modelling fossil discovery:
    If fossils have been added, the more recent fossils in the higher sedimentary layers are exposed as the top layers erode away (fall off the top of the model). The lower layers with their older fossils will likely remain hidden.
    Older fossils in real rock are harder to find as they are more rarely exposed, while the newer fossils are more frequently revealed as sedimentary uplifting occurs. A fossil is dated by the age of the sedimentary rock layer in which it is found.
    Note that real fossils do not just fall out of the rock. Once a part of a fossil is exposed by erosion, geologists carefully chip and brush around it before lifting the fossil out of the rock.
    Using fossils, scientists can construct a map of what life forms existed at what times. Fossils show a gradual change of how living things look through time, over millions of years.
    Fossils have shown how life moved onto land (Tetrapods), how whales evolved from land mammals, and reveal missing links (Archaeopteryx is the missing link between dinosaurs and birds).

    Study the folding patterns:
    Allow students to visit all of the models, to see the different patterns of folding.
    Students can optionally use the attached worksheet to draw the shapes of the folds in models of their choice.
    Pick out a couple of examples to bring to group discussion.
    Show images of real sedimentary folds. Try https://www.geologyin.com/2016/09/10-amazing-geological-folds-you-shoul… or https://www.easternct.edu/cunninghamw/ees-356-teaching-resources/struct…
    Ask students to find the same folding patterns in their models as in the images.
    Just as in their models, real sedimentary rock layers are folded and buckled upwards as tectonic plates converge, move under and over each other. When plates collide and slide past each other, earthquakes happen.
    The Alps and Himalayas were formed over 10s of millions of years - the Alps from the African and Eurasian tectonic plates colliding and the Himalayan Mountains from the convergence of the Indian and Eurasian plates. At the summit of Mount Everest there is marine limestone.
    The Canadian Rockies were formed when the tectonic plate of the Pacific Ocean pushed under (subduction) the continent, causing it to wrinkle upwards.

    Notes

    Finer play sand seems to bleed into the sugar layer more readily than beach sand. Do the grain sizes need to be matched?
    Try fine sand with flour: http://www.ukrigs.org.uk/esos/wiki/index.php5?title=BOU/KS4/Prep
    Or sand with salt

    Large scale video: https://www.youtube.com/watch?v=KvYLuOdf4AY

    Different model of tectonic plates colliding, using a rug bunching up on a smooth floor:
    The mountain-building is analogous to a rug being pushed together on a hardwood floor. The rug bunches up and forms wrinkles (mountains). In Canada, the subduction of the Kula plate and the terranes smashing into the continent are the feet pushing the rug, the ancestral rocks are the rug, and the Canadian Shield in the middle of the continent is the hardwood floor.

    Grades taught
    Gr 1
    Gr 2
    Gr 3
    Gr 4
    Gr 5
    Gr 6
    Gr 7

    Doppler effect

    Summary
    Spin a tone generator (e.g. phone with app) around your head so that students can hear the frequency rising and falling due to the Doppler effect.
    Materials
    • deep, sturdy bag with handles (heavy duty plastic shopping bags that are given away free if you buy enough groceries)
    • long piece of string
    • tone generator e.g. app for phone
    • quiet space for a large circle of students
    Procedure

    Ask students to stand in a wide circle around you, or stand in a clearing in the centre of the classroom.

    Turn on the tone generator (e.g. an application on your phone), set to about 550Hz, and check that students can hear it.

    Put the phone in the bag.
    Tie the string around the handles.
    Spin around your head (letting out the string longer as you speed up).
    Make sure everyone is silent so that students can hear the tone of the note getting higher and lower as it respectively comes towards and away from them.

    Explain that this change in frequency of a sound is called the Doppler effect.
    It is happening because the how close the note of the sound changes with how close the sound waves are together. Closer waves have a higher note and waves spaced further apart have a lower note.
    When the source of the sound is moving towards you, the source catches up with the sound wave that was just emitted, so that the next wave is a little closer to the preceding one. Hence when the waves reach our ear from a source coming towards us, they are all closer together and sound higher.
    When the source of the sound is moving away, the waves are emitted from a further and further distance away, so the waves are spaced further apart, hence sound lower.

    Also heard with a car horn on while driving by. Find on youtube e.g. hear a car horn passing at https://www.youtube.com/watch?v=a3RfULw7aAY

    Grades taught
    Gr 4
    Gr 5
    Gr 6
    Gr 7

    Making mixtures: solutions, suspensions and colloids

    Summary
    Shake water with various solids, to discover different kinds of mixtures - suspensions, colloids and solutions
    Materials
    • squeeze bottles of water
    • little clear pots with sealable lid, 2 or 3 per student
    • powders to shake with the water that will make different kinds of mixtures e.g. flour, baking soda, sugar, sand, milk powder
    • optional additional powders to add in after discussing mixture types, to add colour: drink crystal mix
    • small scoops e.g. wooden coffee stirrers snapped in half
    • waste tub
    • cloths for cleanup
    Procedure

    Students start by mixing each of the materials in turn with water. then using the key on the worksheet to find out what kind of mixture they have made.
    Ensure that they only add a small amount of powder and fill the little pot most of the way with water. They shake hard for 10 seconds, then immediately look for particles of the material settling on the bottom. If particles do settle, they have made a suspension. If no particles settle, they should look for whether the mixture is clear or not. If it is, they have made a solution. If it is not clear, they have made a colloid.

    Once students have tried all the substances individually with water, discuss the properties of each:
    A suspension has clumps of one material in another. The clumps are large enough to be pulled down by gravity and settle on the bottom. Sand in water should act in this way, and also flour in water if a lot is added.
    A solution will not have any particles large enough to settle. Their molecules are completely evenly mixed together. Light can pass through a solution so it looks clear - this is because individual molecule is too small to block light. Baking soda and sugar form solutions. (If students add enough sugar or baking soda, some will not dissolve and will settle to the bottom, so making a suspension.
    A colloid has small clumps of one material in another (e.g. milk in water or flour in water). The clumps are not large enough to settle out, so they stay suspended in the liquid. The particles are large enough to block light, so a colloid does not let light pass through, and looks cloudy. If students add enough flour or milk powder, some may settle on the bottom and be classified as a suspension.

    Optional: to see the tiny particles of a colloid under a microscope, make a slide of milk (2% works well) and view through a transmission scope at 100X or 400X. You can see the variously-sized fat droplets floating in the liquid water and other substances (sugars, proteins).
    Optional extension: point out the jiggling motion of the fat droplets due to Brownian motion.

    Relate to familiar mixtures:
    suspension - silt in a river is deposited. Sedimentation is used to treat water for drinking - contaminants are coagulated first, then filtration is used to separate the clumps out.
    colloid - milk. other oil in water - salad dressing.
    solution - salt, coffee, apple juice - various molecules in solution with water

    Allow free play time for students to mix the materials together as they wish, followed by discussion of the mixtures they made, and why those combinations of molecules behave in that way.
    They will like to make dough, by adding a lot of flour and maybe other ingredients to a little water. The long flour molecules form a dense mat which thickens up the water to form the texture of the dough.
    They may notice different particles settling at different rates - the larger ones (likely sand particles) should settle more quickly. This same separation happens on stream beds.

    Notes

    This is a more focused exploration of mixtures. Mixing solids and liquids is a more general discovery of mixtures and chemical reactions.

    Students sometimes see sand as a solution and baking soda/sugar as a suspension. Adjustments, so that sand is classified as a suspension: put it at the top of the list on the worksheet. Adjustment, so that a solution definition is clear: does the solid "disappear" into the water? Maybe have students describe what happens, then define later i.e. skip the key.

    Trying to show light passing through, or not, add a level of complication that was not always clear.

    Try posting game for types of colloids.

    Grades taught
    Gr 4
    Gr 5
    Gr 6
    Gr 7

    NASA ARES educational materials

    Summary
    Lesson plans and images for educational use on how we use geological features on earth to interpret images of other planets.
    Type of resource
    Web page
    Notes

    Through NASA outreach on the ARES website (Astromaterials research and Exploration Science). The Blue Marble Matches is a lesson plan, with amazing images, of planet surface features, and explanations of how to figure out how they were formed by comparing with earth surface features.
    I used the Planetary Feature Cards for images and the Quick Reference Sheet for understanding.

    Temperature sensing

    Summary
    Use warm and cold water to experiment with your temperature receptors.
    Materials
    • tray of cool water with a couple of ice cubes added
    • tray of very warm water (add a little boiled kettle water if necessary)
    • tray of medium temperature water
    Procedure

    Ask students to place one hand in the cold water and one hand in the very warm water, and leave them there for at least one minute.
    Then place both hands in the medium temperature water. What temperature does each hand feel? (I found it easier to place one hand at a time in the medium temperature water, as the different sensations coming from each hand make it hard for the brain to process what is going on in each hand.)

    Students should find that the hand that was in the cold water will feel warm, and the hand that was in the warm water feels cold.
    The temperature receptors, called "thermoreceptors" in your hand detect temperature changes, and signal that change to your brain. After a while in water of one temperature, they get used to that temperature, and on being immersed in a different temperature signal the relative change in temperature. Hence the colder hand feels warmer, and the warmer hand feels colder, even thought they are both immersed in the same temperature.

    Here is more detail on the receptors that detect temperature:
    We have both cold thermoreceptors that are activated by cold, and warm thermoreceptors that are activated by heat. Cold receptors fire more signals when they are cooled, and decrease the signals sent during warming. Warm receptors increase signal rate when they feel warmth and decreased signal rate on cooling. But, in addition, either thermoreceptor, when exposed to the same temperature for a while, will tire and stop sending signals about the temperature. Hence the hand that gets used to cold has cold receptors that are tired, so when it enters the medium water only the warm receptors will fire. By contrast, in the hand that gets used to warm, the warm receptors have become tired, and when the hand enters the medium water only the cold receptors will fire. Hence different signals are sent about the same temperature water.

    Notes

    Selkirk paired this with light attraction of brine shrimp for a lesson on animals sensing.

    Grades taught
    Gr 3
    Gr 4
    Gr 5